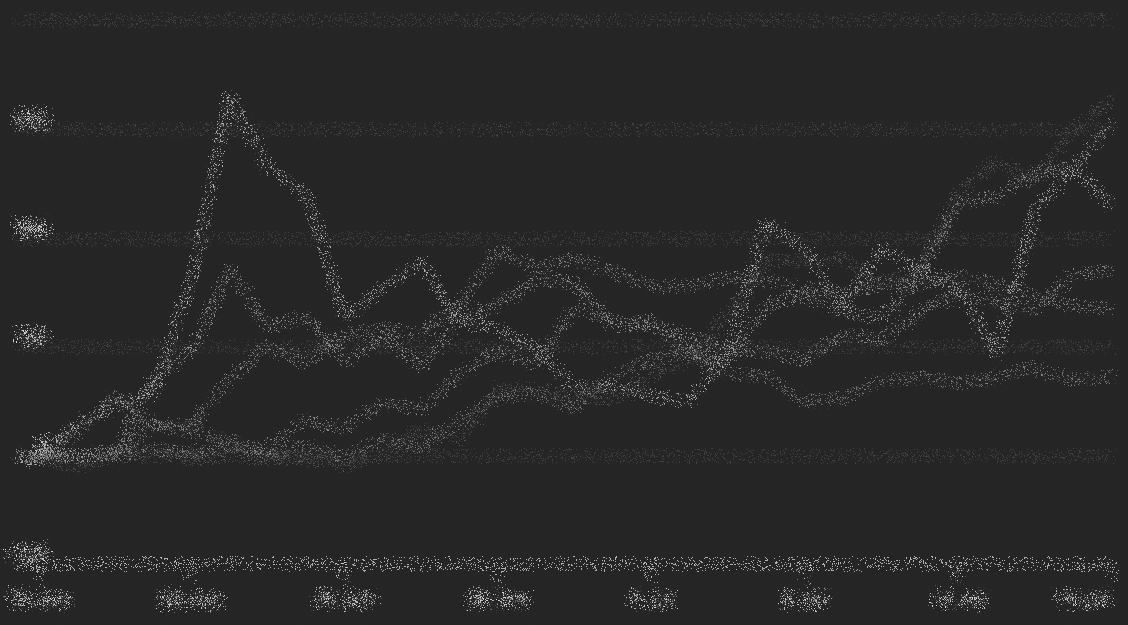
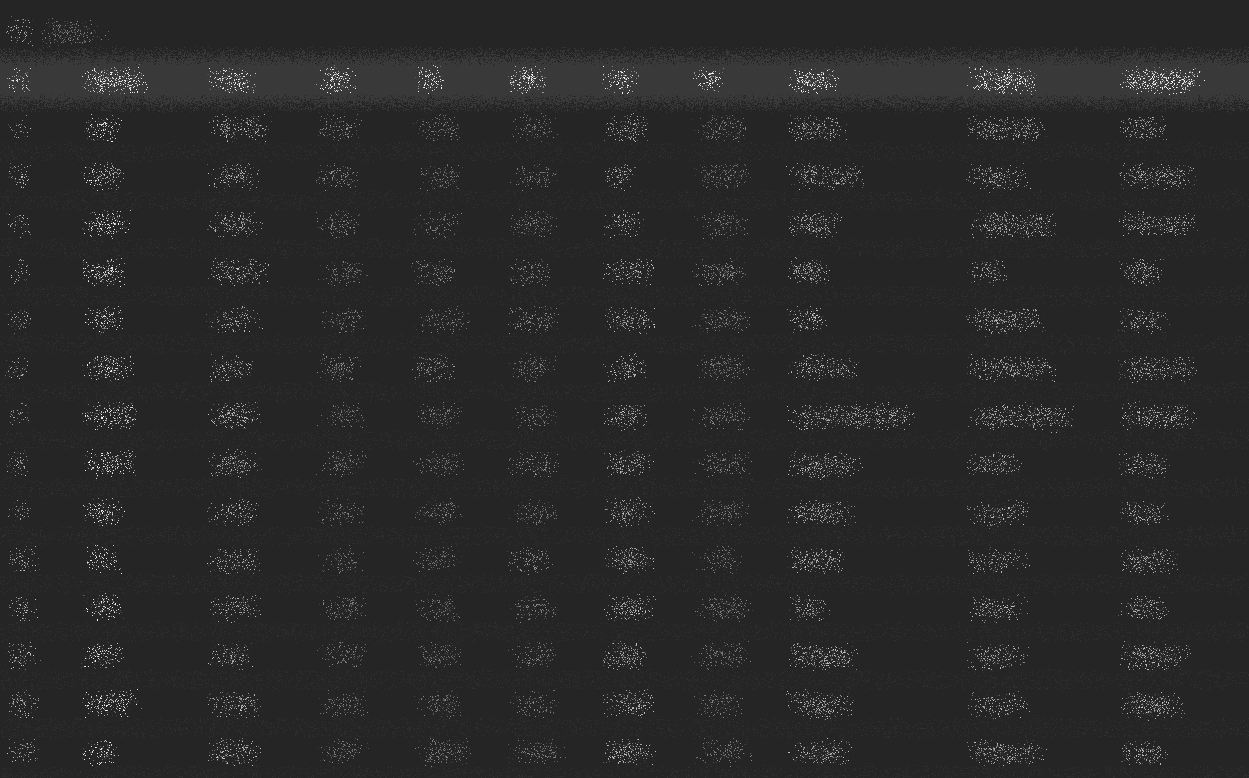
Meme
Top Tokens
Shows price performance of the top tokens in the Meme Sector as percentage changes during the selected time period.
228 | 5.87% | 4.99% | 117% | $315M | $37M | |||
1000 | 5.24% | 41.41% | 113% | $28M | $600K | |||
3980 | -3.32% | 11.30% | 11.32% | $766K | $5.3K | |||
581 | 13.42% | 68.81% | -0.13% | $75M | $7.3M | |||
260 | -1.50% | -2.32% | -6.98% | $259M | $10M | |||
1758 | -4.34% | 0.83% | -12.22% | $7.5M | $133K | |||
1354 | -33.50% | -57.99% | -18.95% | $15M | $86K | |||
4220 | -1.04% | -2.98% | -20.36% | $621K | $63 | |||
551 | -1.05% | -4.14% | -20.37% | $82M | $169K | |||
40 | -6.46% | 10.88% | -21.61% | $3.8B | $1.9B | |||
7909 | -10.55% | 0.00% | -23.04% | $23K | $247 | |||
202 | -3.11% | 12.98% | -24.03% | $371M | $4.3M | |||
6331 | -6.41% | -4.41% | -25.19% | $97K | $1.7K | |||
520 | -6.60% | 5.81% | -25.32% | $92M | $3.4M | |||
1690 | 2.89% | 22.85% | -27.07% | $8.4M | $178K |
1–15 of 85 items
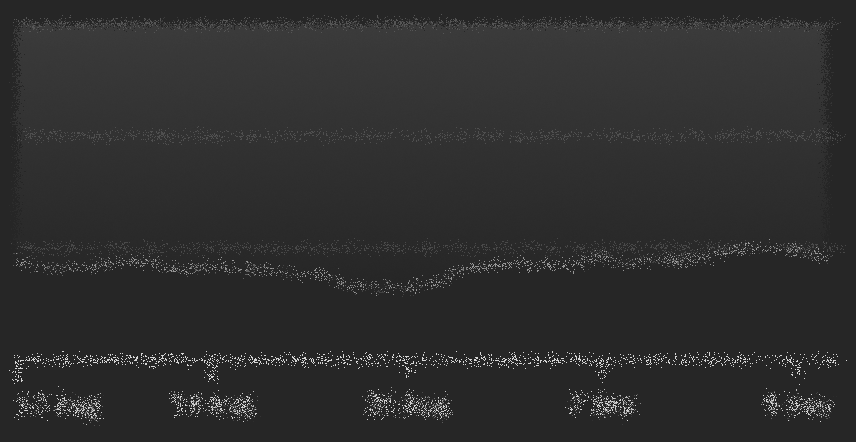
Equal vs. Standard Weight
Shows the difference between equal and standard weighted indices. The chart turns green when the equal-weighted index outperforms the standard-weighted one, typically during bull markets.
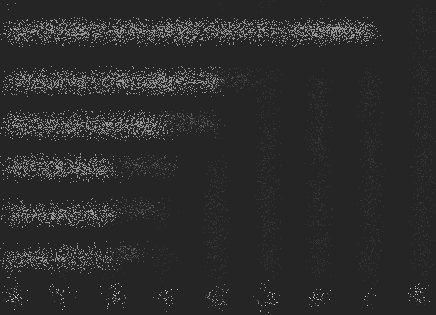
Top Meme Blockchains
Shows the best performing blockchains in the Meme Sector during the selected time period.
Top Meme Tags
Shows the best performing tags in the Meme Sector during the selected time period.