Token Details
On the Token Details page gives you a detailed overview of the token. You can see the token's price, market cap, volume, and more.
Header
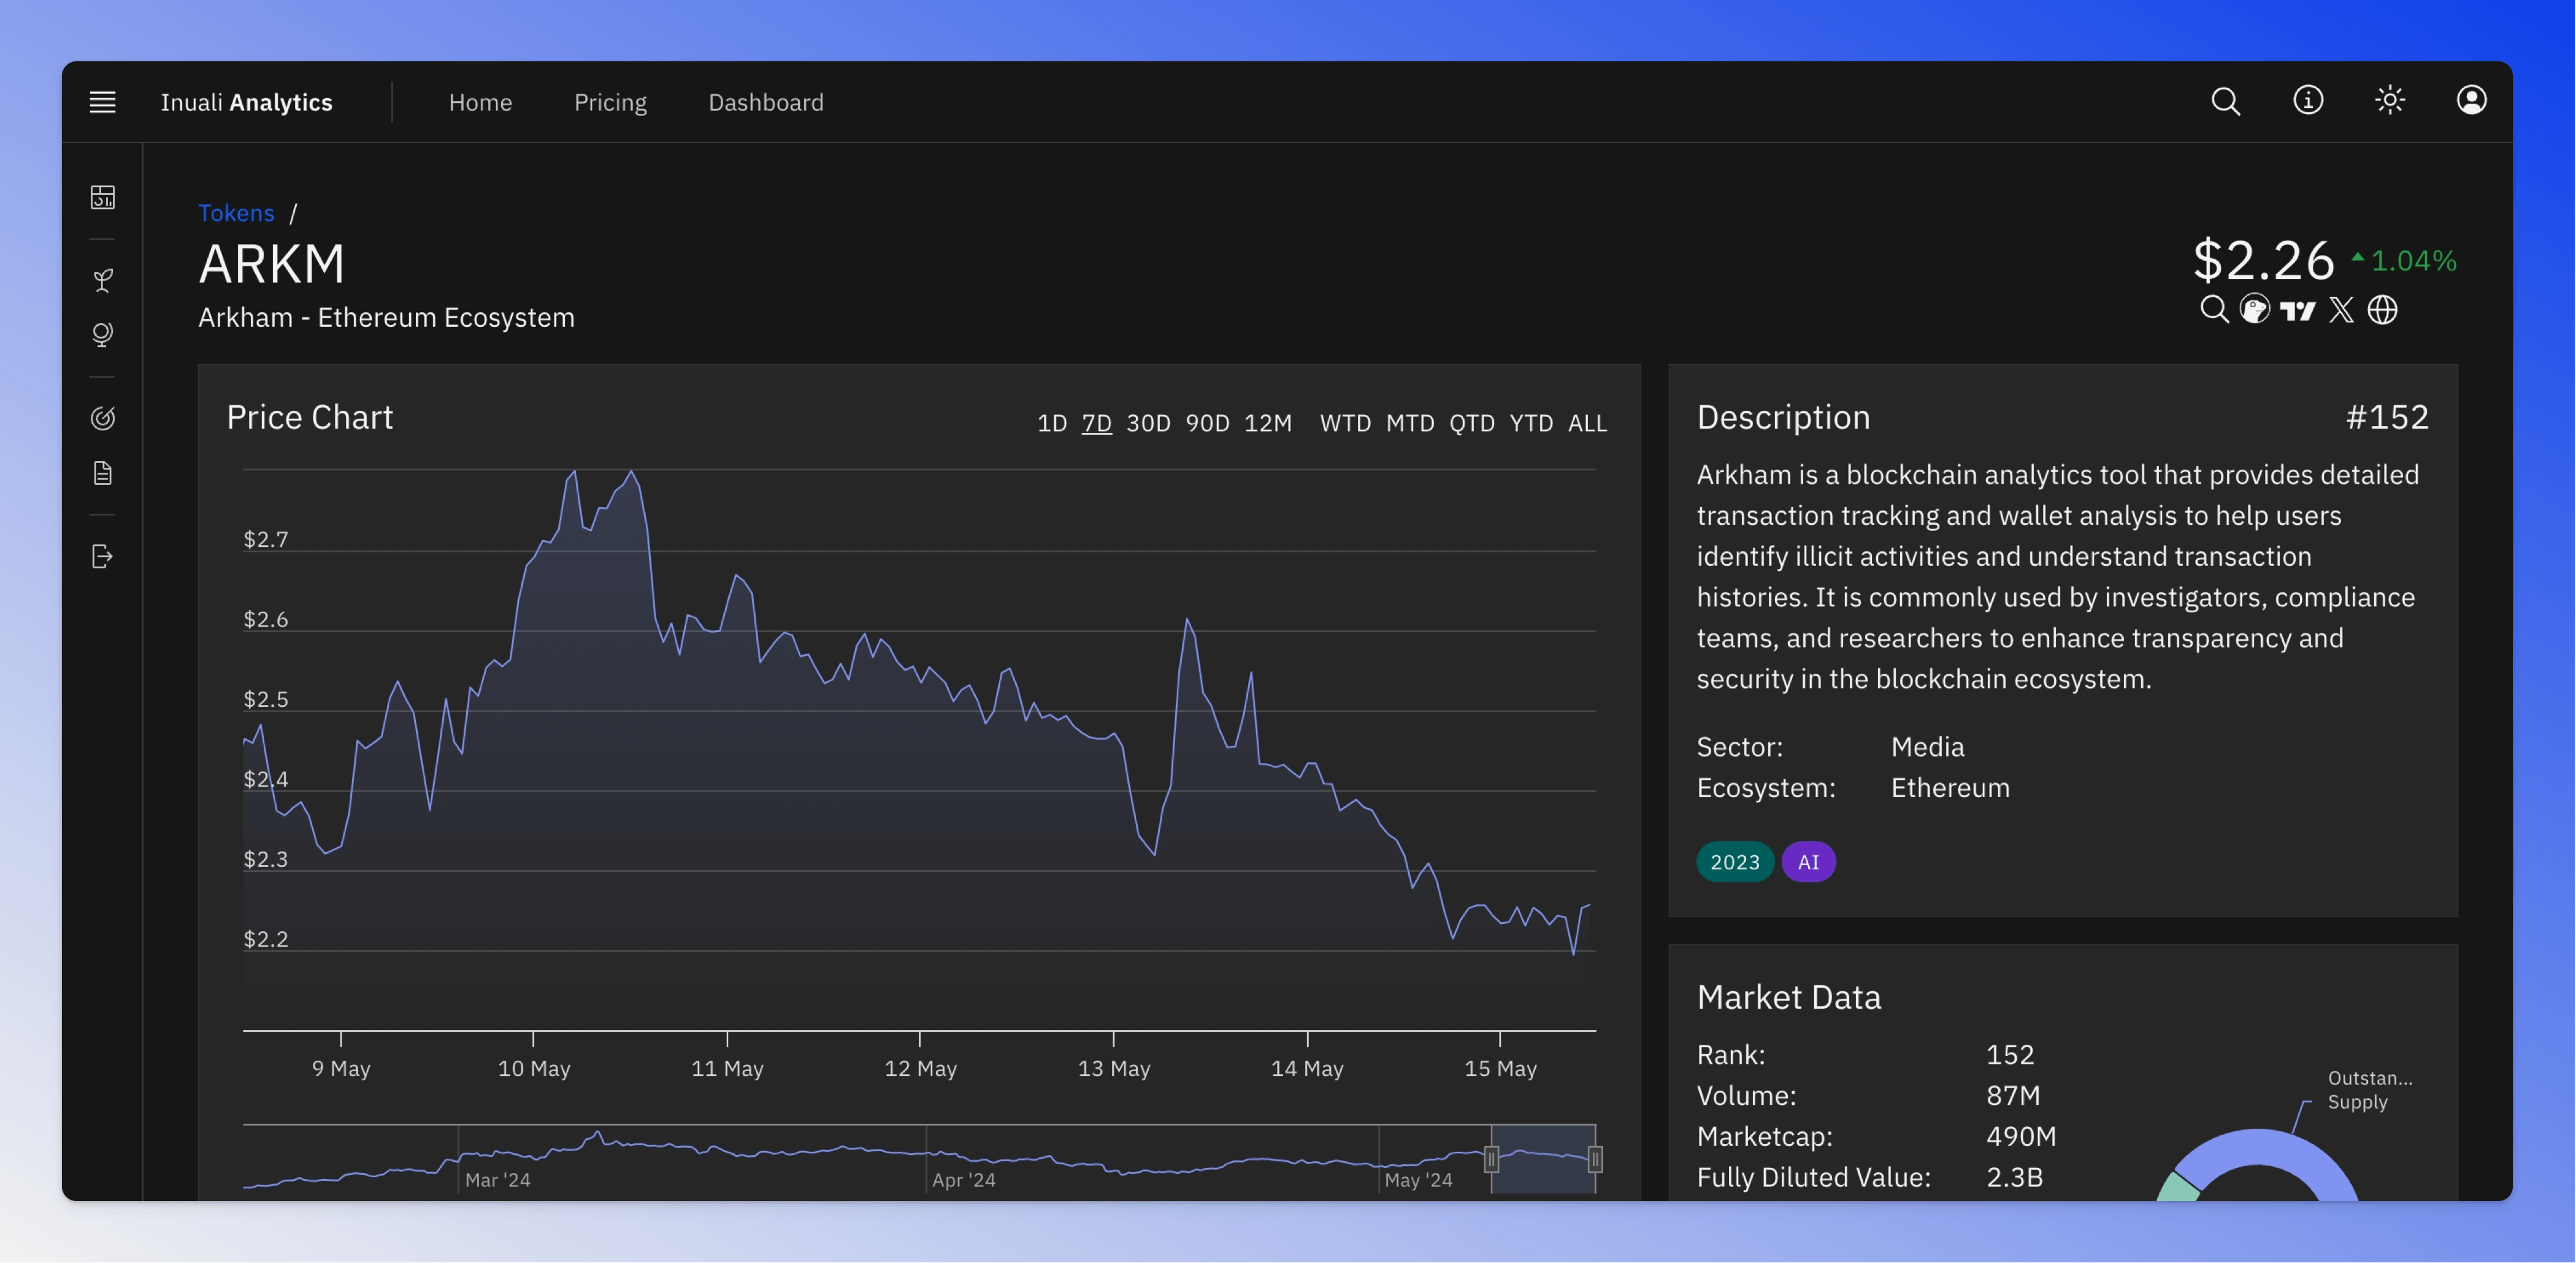
The header of the Token Details page shows the token's symbol, name, ecosystem, price and price change. The price change is calculated as the difference between the current price and the price at 00:00 UTC.

Directly below the price, you can find quick links to external resources:
- Search: Find the token's ticker on X.
- Coingecko: Lookup the token on Coingecko.
- TV: View the token's ticker on Tradingview.
- X: Explore the token's profile on X.
- Web: Visit the token's official website.
The price is updated every hour and the last update time is shown on mouse hover.
Price Chart
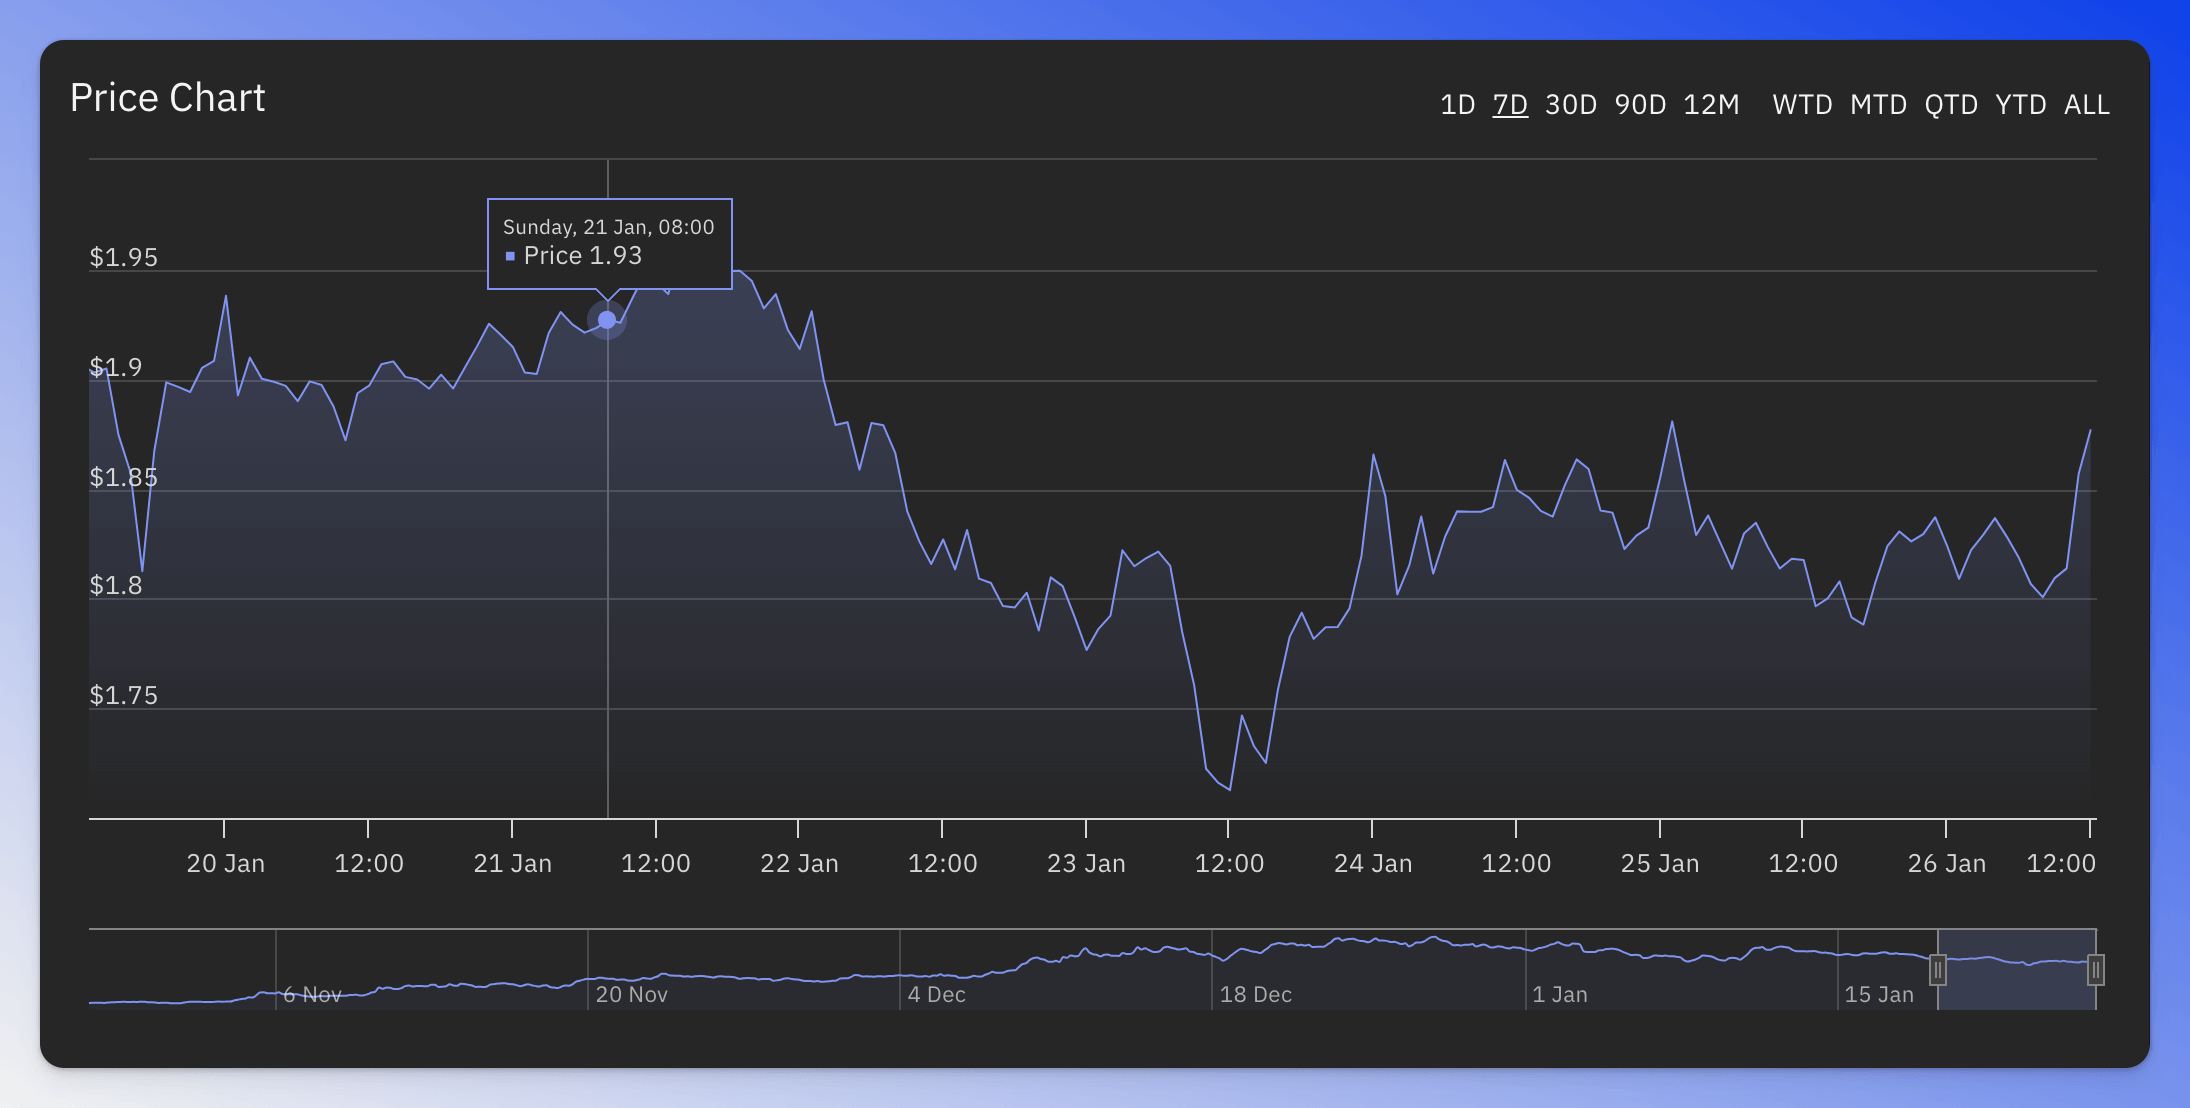
The price chart shows the token's price over time. You can change the time frame by clicking the buttons on top right or by using the navigator below the chart.
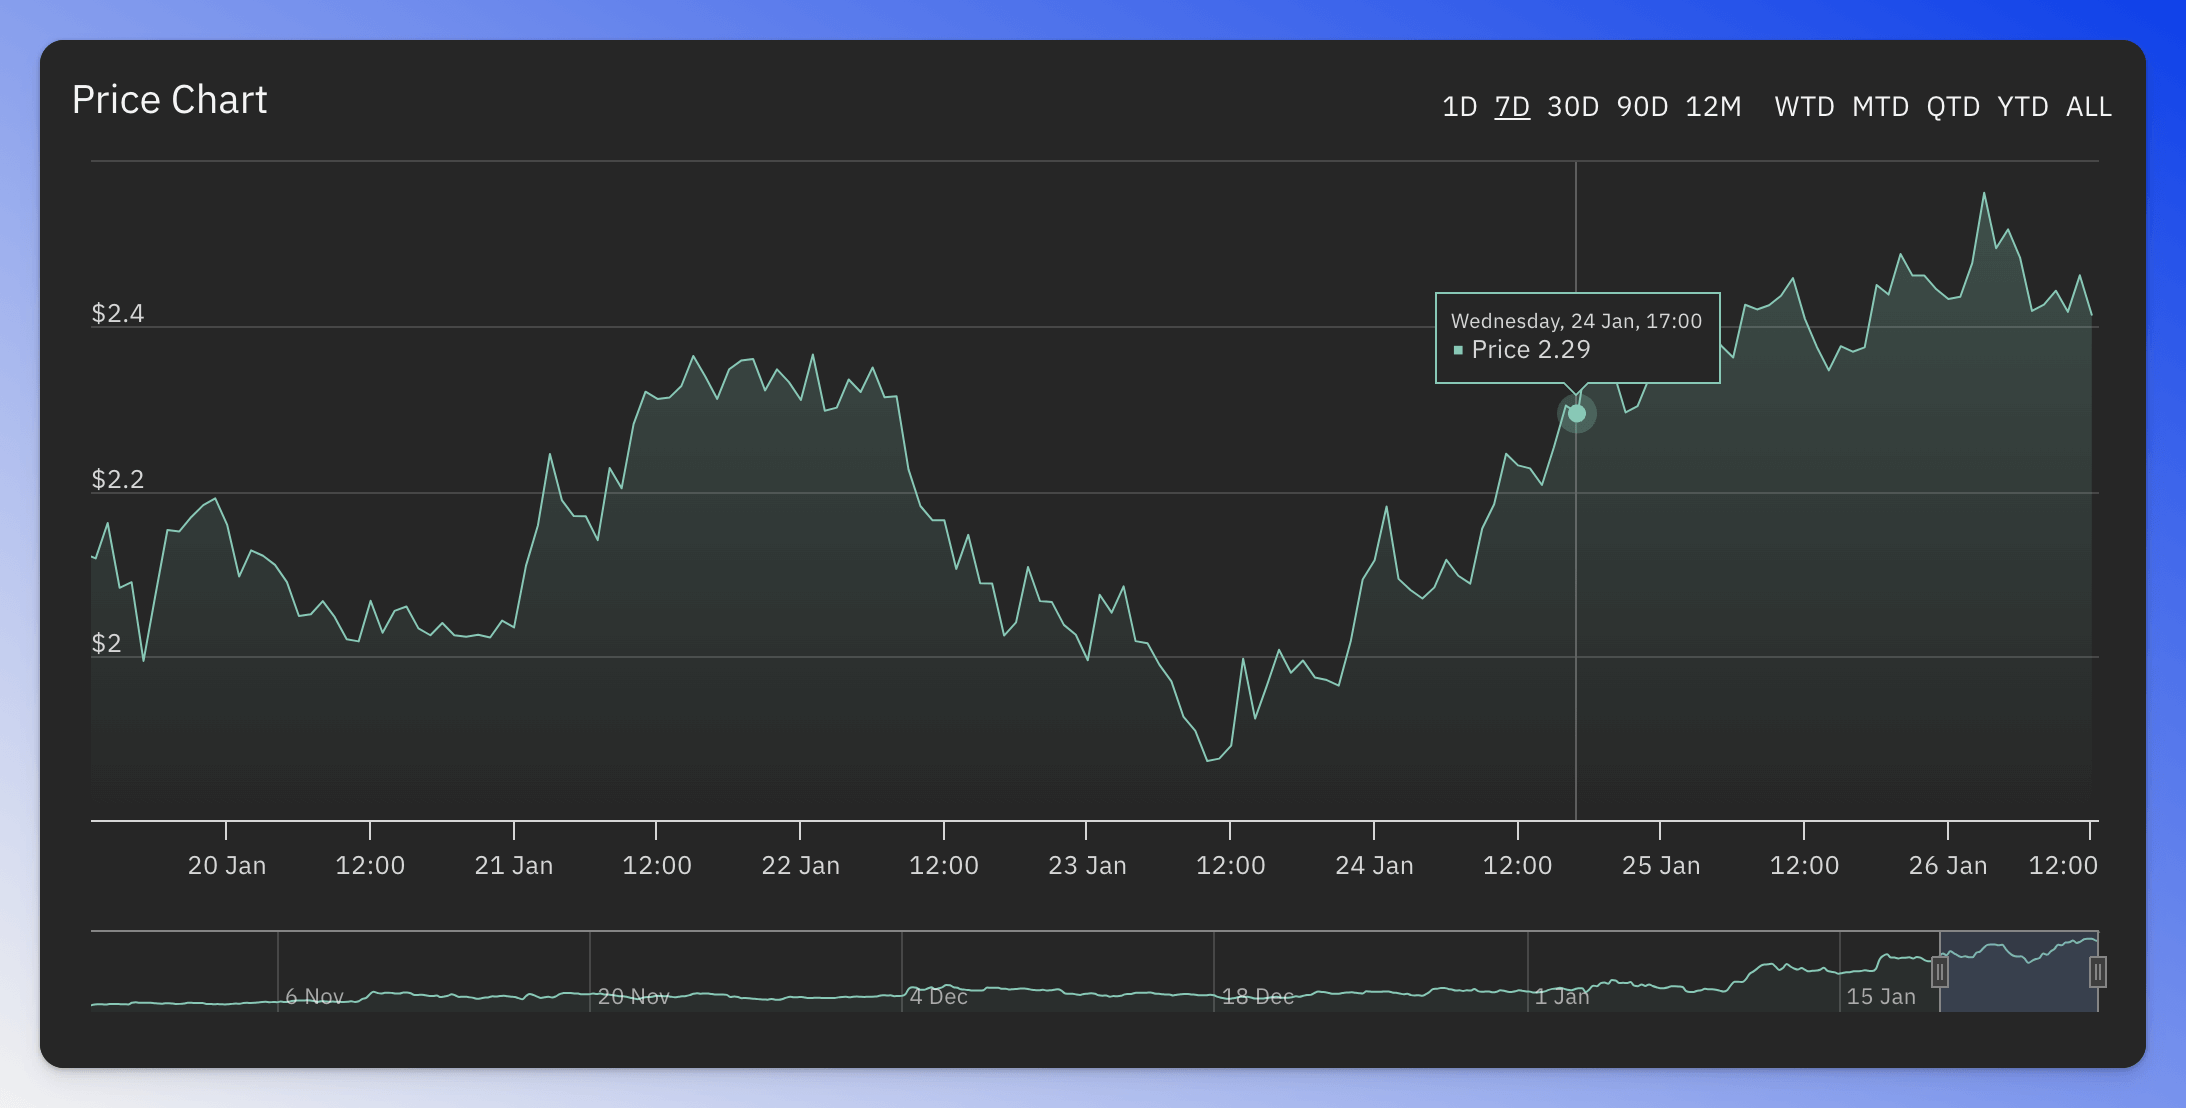
When the following conditions are met, the chart will change its color to green, indicating a bullish trend:
- ADMA-10: Price is above the 10-period daily SMA.
- ADMA-50: Price is above the 50-period daily SMA.
Description
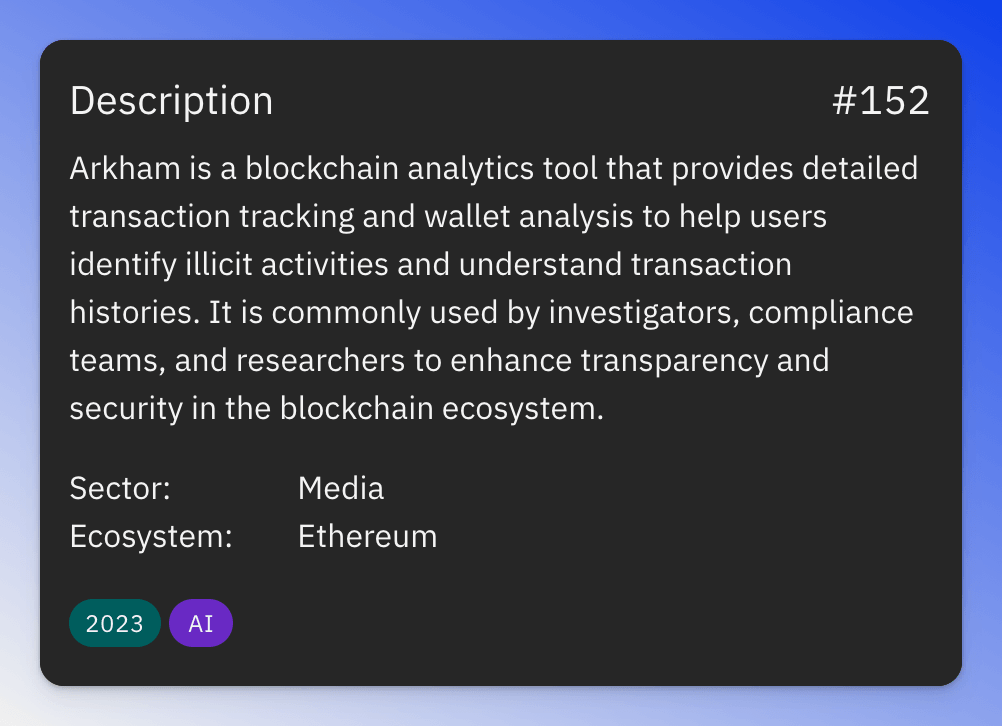
The Description tile shows a short description and in which ecosystem and sector the tokens belongs to. On the top right of the tile, you can find the market cap rank of the token.
If you click on the sector, the ecosystem name, or the tags, the screener view with a corresponding pre-selected filter will open.
Market Data
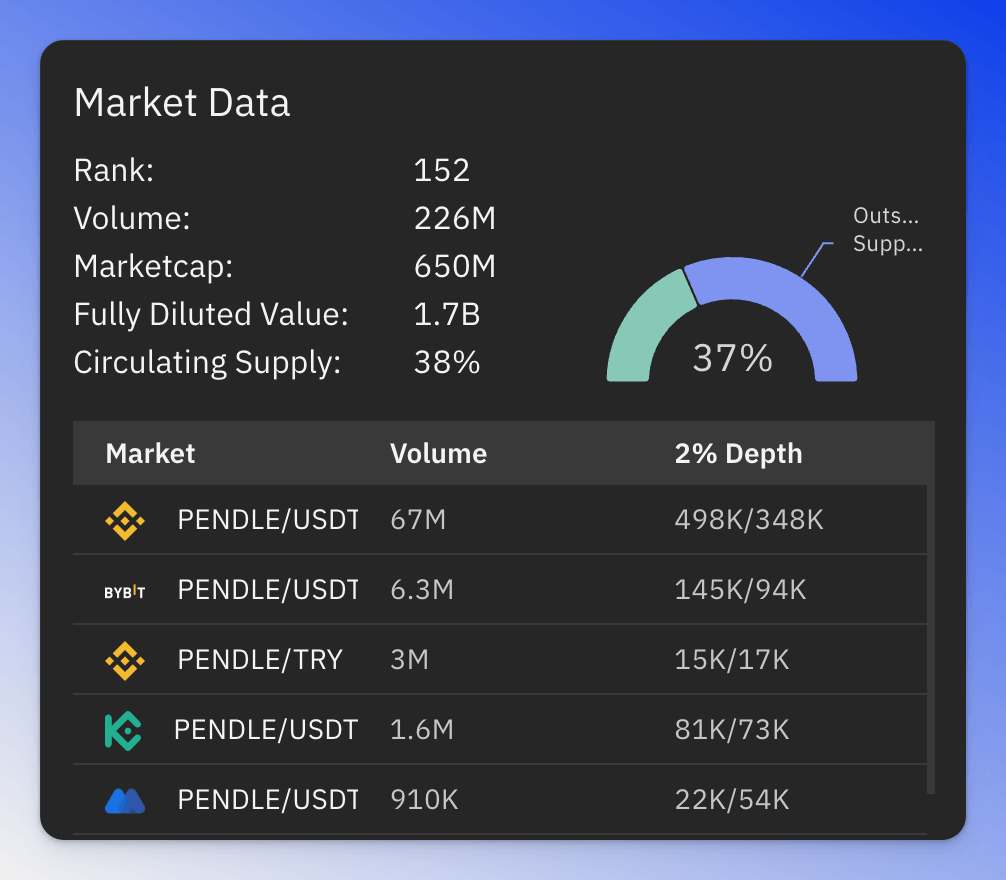
The top section of the market data tile displays the token's market cap, volume, circulating supply, and the fully diluted market cap. Below, you can see where the token is traded and where liquidity is deepest. The order book depth gives you an indication of how much capital is required to move the market 2% up or down.
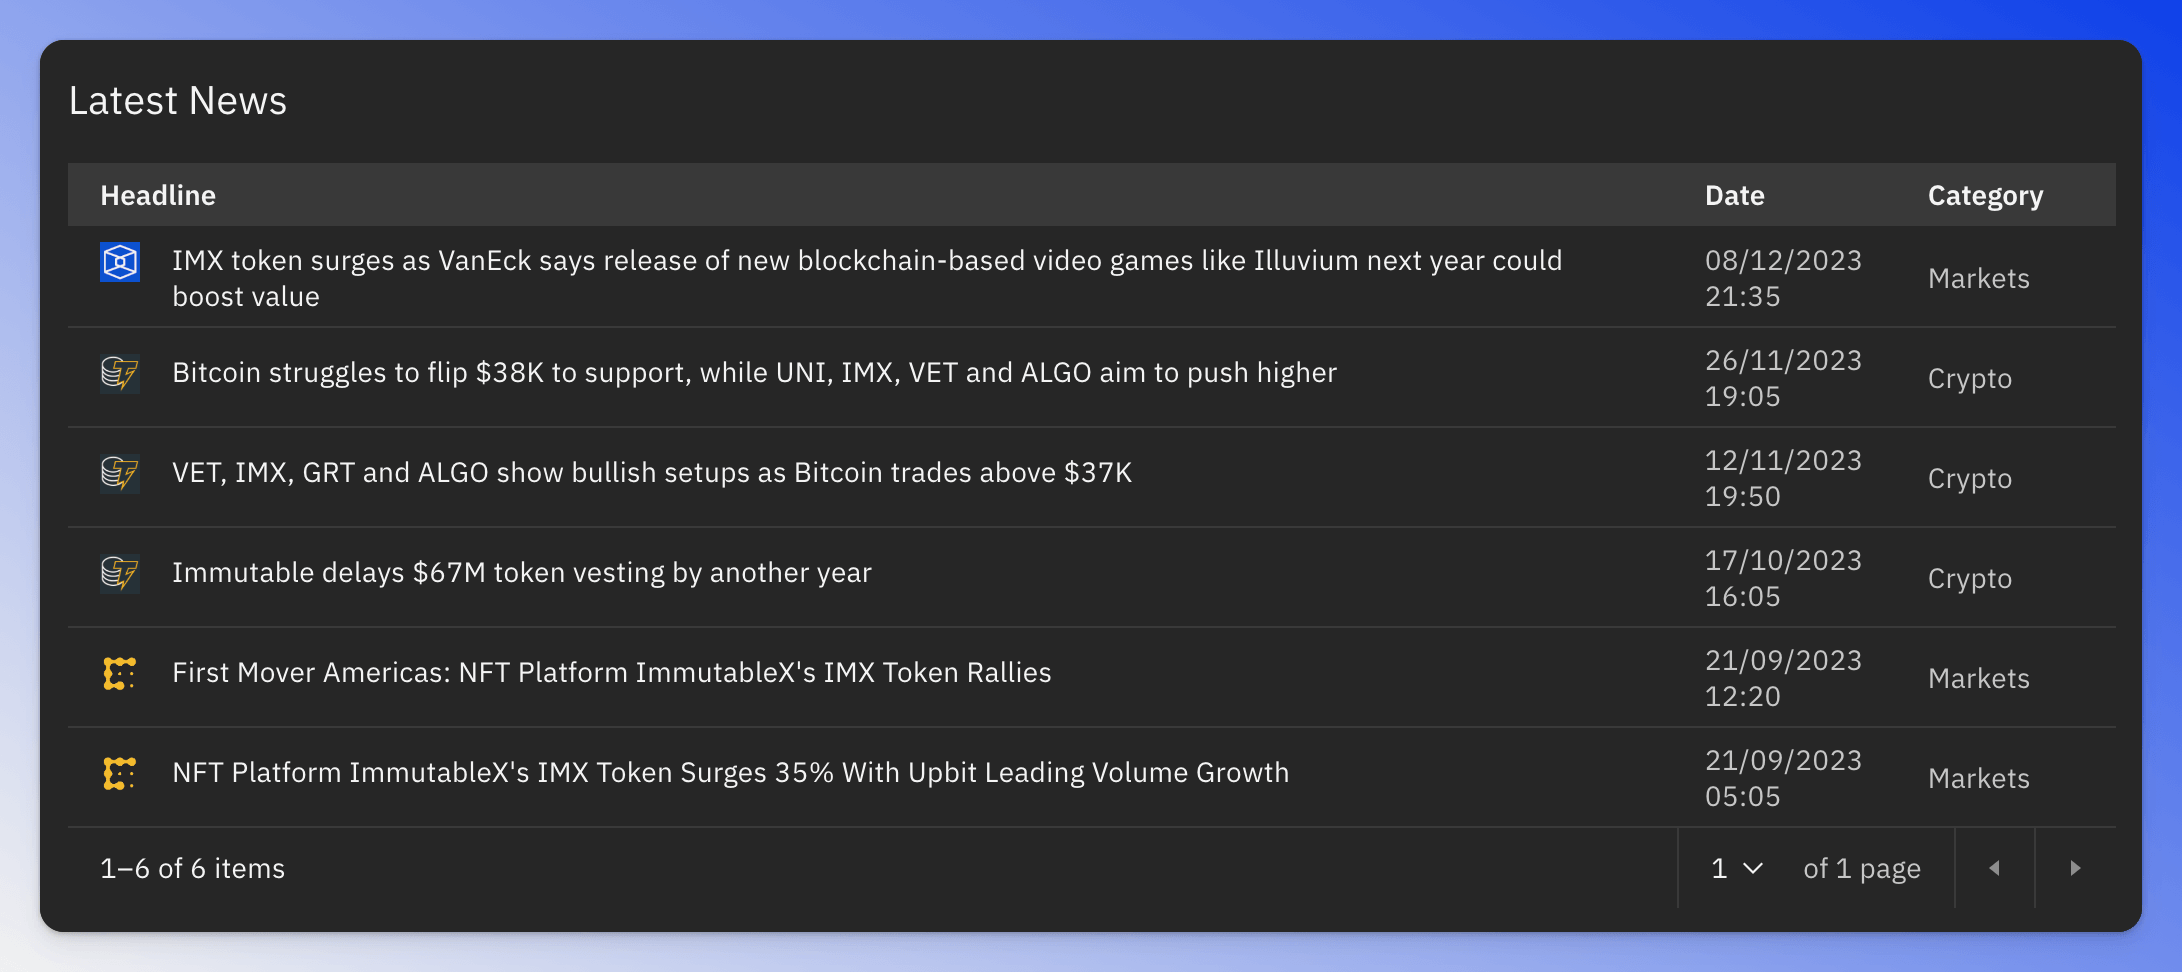
Latest News
The latest news section shows the latest news articles related to the token.
